Accelerated environmental test for LEDs, High temperature and humidity failure analysis,
Total luminous flux, Spectral distribution measurement by large integrating sphere
■Accelerated high temperature and high humidity test
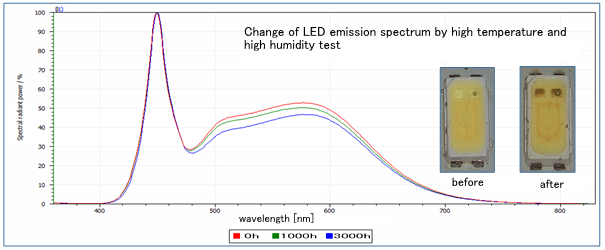
LED products are known to deteriorate sealing resins, phosphors, reflectors, and bonding due to high temperature and humidity, resulting in total luminous flux decrease and emission color change. In addition to the degradation evaluation of LEDs (LED chips, LED modules) under high temperature and humidity conditions, a separate high temperature test under low humidity conditions can be used to investigate the degradation under the high temperature and effect on the LED by high temperature.
LED products are known to deteriorate sealing resins, phosphors, reflectors, and bonding due to high temperature and humidity, resulting in total luminous flux decrease and emission color change. In addition to the degradation evaluation of LEDs (LED chips, LED modules) under high temperature and humidity conditions, a separate high temperature test under low humidity conditions can be used to investigate the degradation under the high temperature and effect on the LED by high temperature.
■Temperature
Cycling Test
The LED quality can be evaluated with repeated thermal loads. In addition to tests based on standards, flexible test conditions can be set combining temperature and humidity.
The LED quality can be evaluated with repeated thermal loads. In addition to tests based on standards, flexible test conditions can be set combining temperature and humidity.
■Thermal
Shock Test
As well as the thermal shock test required by the standard, we can offer the temperature range from -65 ° C to + 300 ° C, to achieve the desired severe heat stress.
As well as the thermal shock test required by the standard, we can offer the temperature range from -65 ° C to + 300 ° C, to achieve the desired severe heat stress.
■Failure
Analysis
The cause of the LED chip deterioration is determined through accelerated testing. We use SEM-EDX, chemical analysis, and other methods to investigate the causes of failures, such as the location of deterioration and defects in material deterioration.
The cause of the LED chip deterioration is determined through accelerated testing. We use SEM-EDX, chemical analysis, and other methods to investigate the causes of failures, such as the location of deterioration and defects in material deterioration.
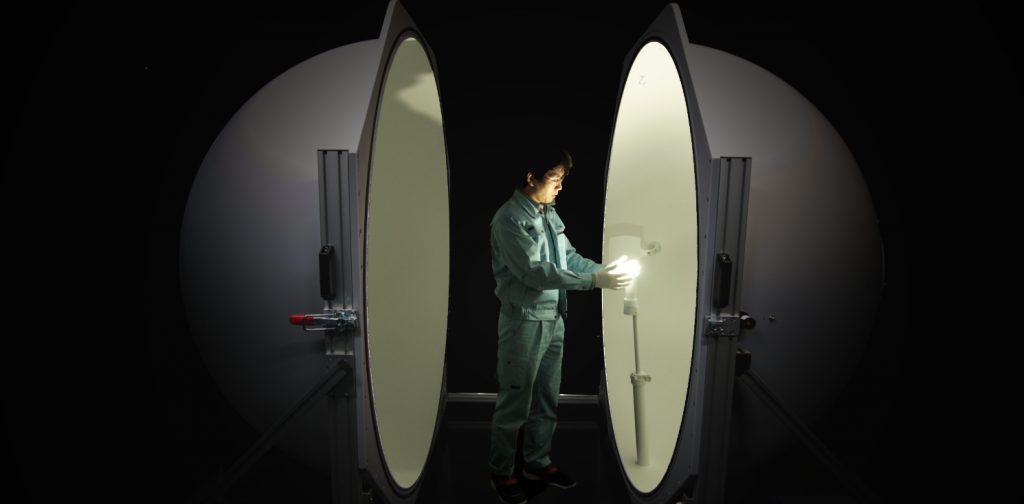
To evaluate the performance and reliability of LED and other lighting equipment, we provide highly accurate measurement results using a large integrating sphere with a diameter of 2 m and a spectrophotometer. By measuring and analyzing changes in brightness and spectral distribution before and after the reliability test, we can investigate the cause of deterioration.
●Main specifications
of integrating sphere and spectrometer
| Measurement Sample Diameter | Maximum 1,600㎜(corresponding to general straight tube type LED [fluorescent light type LED]) |
| Spectral measurement wavelength range | 360nm~830nm(corresponding to Visible light range) |
| Wavelength resolution / accuracy | 0.5nm/±0.3nm |
| Measurement parameter | Total luminous
flux, relative spectral distribution
(spectral spectrum), correlated color
temperature, chromaticity, Color rendering index, luminous efficiency |
| Regarding the measurement by integrating sphere | ||
 |
 |
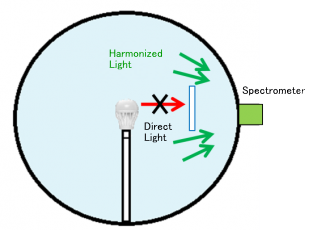 |
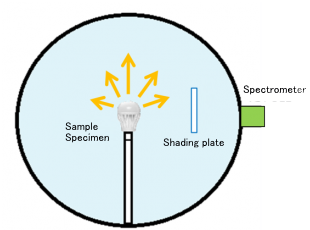
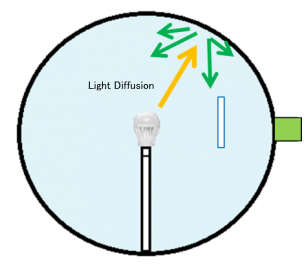
| ① Place the test sample in the center of the integrating sphere. Shading plate is installed so that the light from the sample does not enter the spectrometer directly. | ② The inner wall of the integrating sphere is coated with white paint with high reflectivity, so the light will diffuse back and forth across the wall. Repeated diffuse reflection homogenizes the light intensity in the integrating sphere. | ③ Homogenized light is detected with a spectrometer. Since the detected light is homogenized, the total luminous flux of all the light emitted from the sample could be obtained. In addition, various relative spectral distributions, correlated color temperature, chromaticity, color rendering index, and luminous efficiency are simultaneously measured. |
■Total luminous flux
The luminous flux emitted in all directions is called the total luminous flux and represents the amount of light emitted by a light source. It is an indicator of the brightness of the lightning equipment and is expressed in lm (Lumen)
The luminous flux emitted in all directions is called the total luminous flux and represents the amount of light emitted by a light source. It is an indicator of the brightness of the lightning equipment and is expressed in lm (Lumen)
■Relative spectral distribution
The spectral distribution from 360 nm to 830 nm, which is in the visible light range, is measured. By measuring the spectral distribution, it enables possible to evaluate not only the brightness but also the color tone of light such as color temperature, color rendering, xy chromaticity coordinates.
The spectral distribution from 360 nm to 830 nm, which is in the visible light range, is measured. By measuring the spectral distribution, it enables possible to evaluate not only the brightness but also the color tone of light such as color temperature, color rendering, xy chromaticity coordinates.
Contact information
PIC: Haruhiko Kurimoto (Mr.)
TEL:+81-551-42-5061